01 · The challenge
Why would a rider care about a growth system?
The brief was to improve Qingju’s growth system with user engagement as the goal. Our review of the product at the time found tasks, levels, badges and points separated from one another, with progress and benefits buried in the navigation.
I proposed leisure cycling as the research direction. Commuting usually has a fixed destination; parks, greenways and city exploration introduce questions about where to go, what to see and what to remember. This was a scenario hypothesis that shaped the research.
Growth should connect to what people want from a ride, rather than remain a number that accumulates after unlocking a bike.
02 · Research
Understand the ride before designing the reward.
We combined interviews, a questionnaire and field observation to explore leisure riders’ behaviour, motivations, sharing habits and awareness of benefits. The original project documentation records 11 interviewees, 128 questionnaire returns and 85 valid responses.
Recurring themes in the interview summaries included discovering unfamiliar places, visiting shops with friends, and recording or sharing a ride. I contributed to the early research and interviews, then translated these themes into personas and journeys.
03 · Synthesis
Map the opportunities before, during and after a ride.
A list of needs—exploration, social connection, memories—was not enough to guide the interface. Through user modelling and journey maps, I connected them to specific moments: choosing a route, pausing along the way and reflecting afterwards.
Make choosing easier
Help people find places and routes that match their interests, reducing the effort of planning in an unfamiliar area.
Leave room to explore
Connect the experience to places along the route and progress through the ride.
Make the ride memorable
Connect memories, rewards and sharing so the experience has value beyond the journey itself.
04 · Design decision
Let rewards follow the experience.
We did not treat another points-and-badges system as the only answer. Instead, we connected route discovery, ride records and growth benefits in one path. The ride itself provides value first; rewards make sense within that experience.
My low-fidelity work translated the opportunities into screens and flows for route selection, ride records, rewards and sharing. It gave the team a concrete basis for discussing entry points and task order before the final visual design.
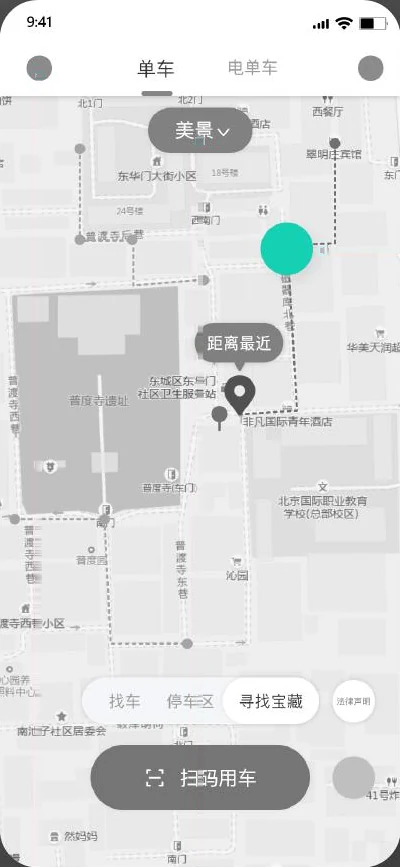
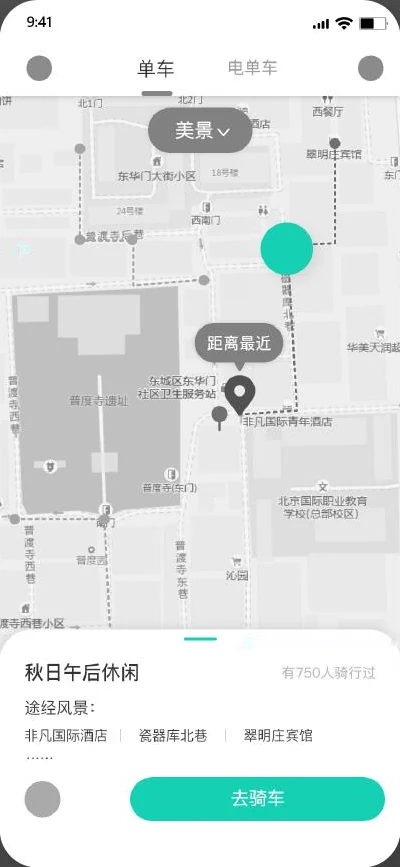
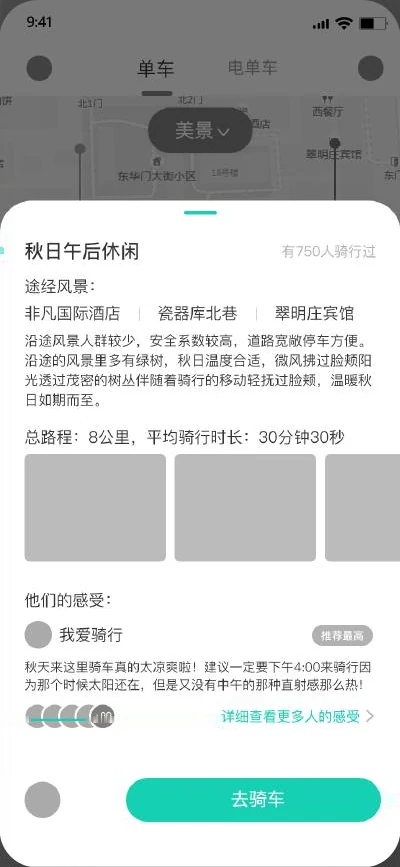
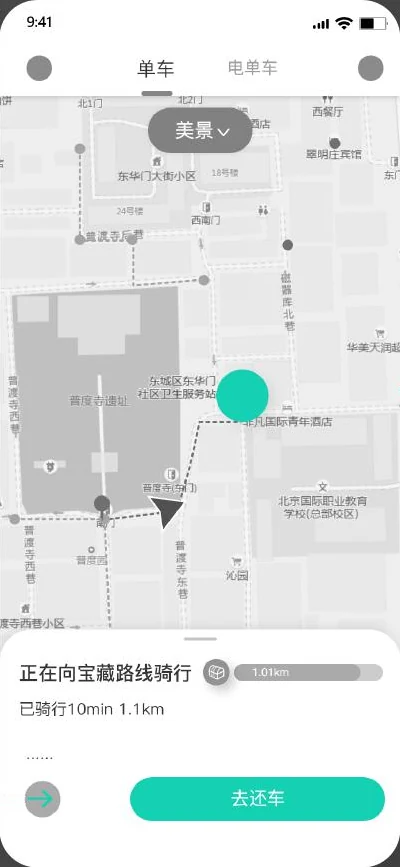
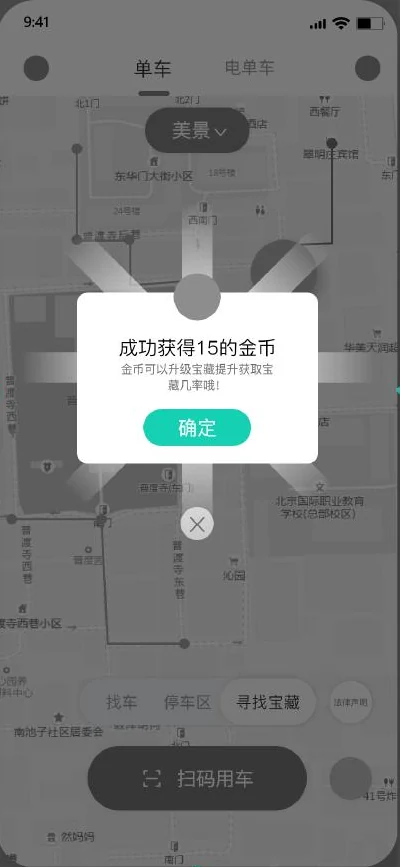
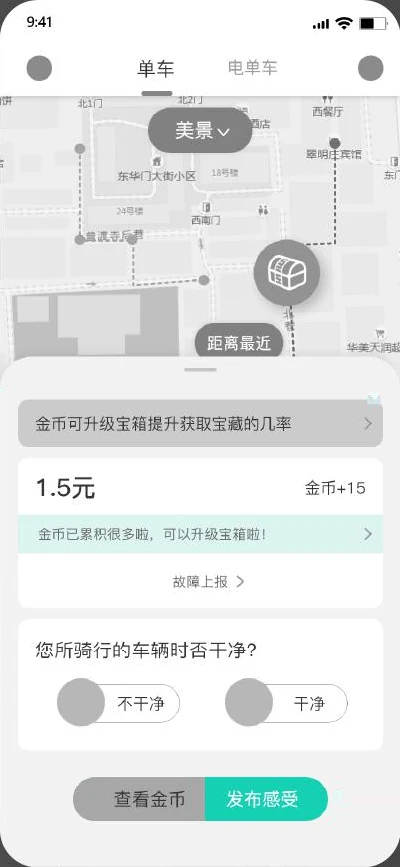
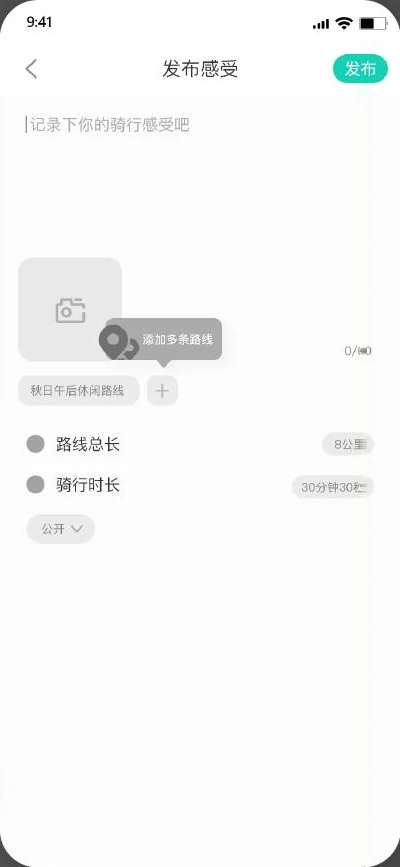
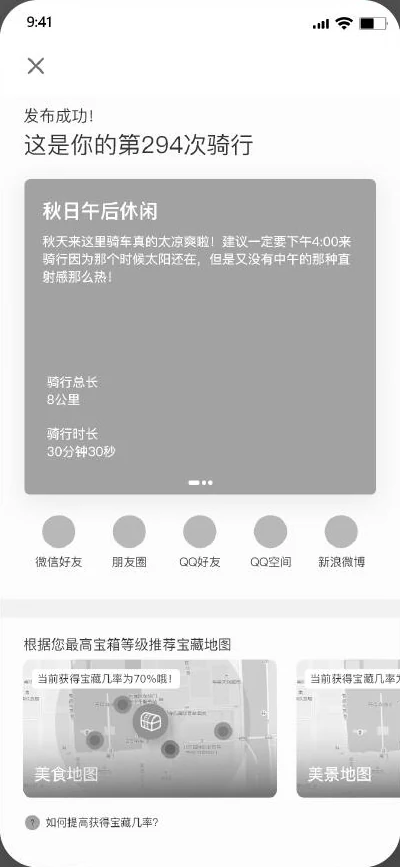
Follow one route through the concept
My 2021 low-fidelity screens, linked in the order drawn on the original board. Tap the real buttons in the screens to move on.
The map is first filtered by what you want to see (美景, scenery). The highlighted dot is a suggested route, not a bike.
Tap the green route marker on the map.
Screens cut from my 2021 low-fidelity board; only the board’s flow arrows were removed. The interface language is Chinese, as in the source. High fidelity was a team output and is not used here.
05 · Trade-offs
A rich concept still needs boundaries.
Connecting routes, shops and rewards creates a more complete experience, but also brings content, partnership and operational costs. We did not include every interesting idea in the first proposal; we organised it around the core journey before and after riding.
Looking back, I would validate a smaller loop first: can someone find a route they want to ride, complete it, and understand the relationship between the ride record and its reward? Wider partnerships should follow evidence that this loop works.
06 · Outcome & reflection
From a business goal to a concrete experience proposal.
The project produced a research synthesis, personas and journeys, wireframe flows, and a team high-fidelity proposal. My central contribution was proposing the leisure-cycling direction and carrying research themes into concrete flows.
This case presents research and design delivery. The available material does not establish an improvement in live engagement. The next step would be observing whether riders can independently understand and complete the proposed journey.
Source: Figma project file ↗ · Access follows the source file’s sharing settings.